Build a "Metrics Inventory" (So You Never Say "No Metrics")
"I don't have any metrics."
This is the most common objection I hear when helping people build tech resumes. And it's almost always false.
What they really mean is: "I didn't formally track my metrics." But the data exists—in calendars, ticket systems, dashboards, logs, retros, performance reviews, and project docs. You just need to know where to look and how to extract it.
I'm going to show you the systematic inventory approach I use with clients. By the end of this, you'll have a metrics library you can pull from any time you need to update your resume—and you'll never say "I don't have metrics" again.
This isn't guesswork. It's data mining. For comprehensive strategies on translating metrics into resume impact, our professional impact dictionary provides the frameworks for every role.
Build your data-backed resume with our professional templates
Why You Need a Metrics Inventory
The Problem with Ad-Hoc Resume Updates
What most people do:
Result: Weak resume with no quantified achievements. Interviews they don't get.
The Inventory Approach
What systematic people do:
Result: Resume ready in under an hour. Every bullet has a metric. Interviews secured.
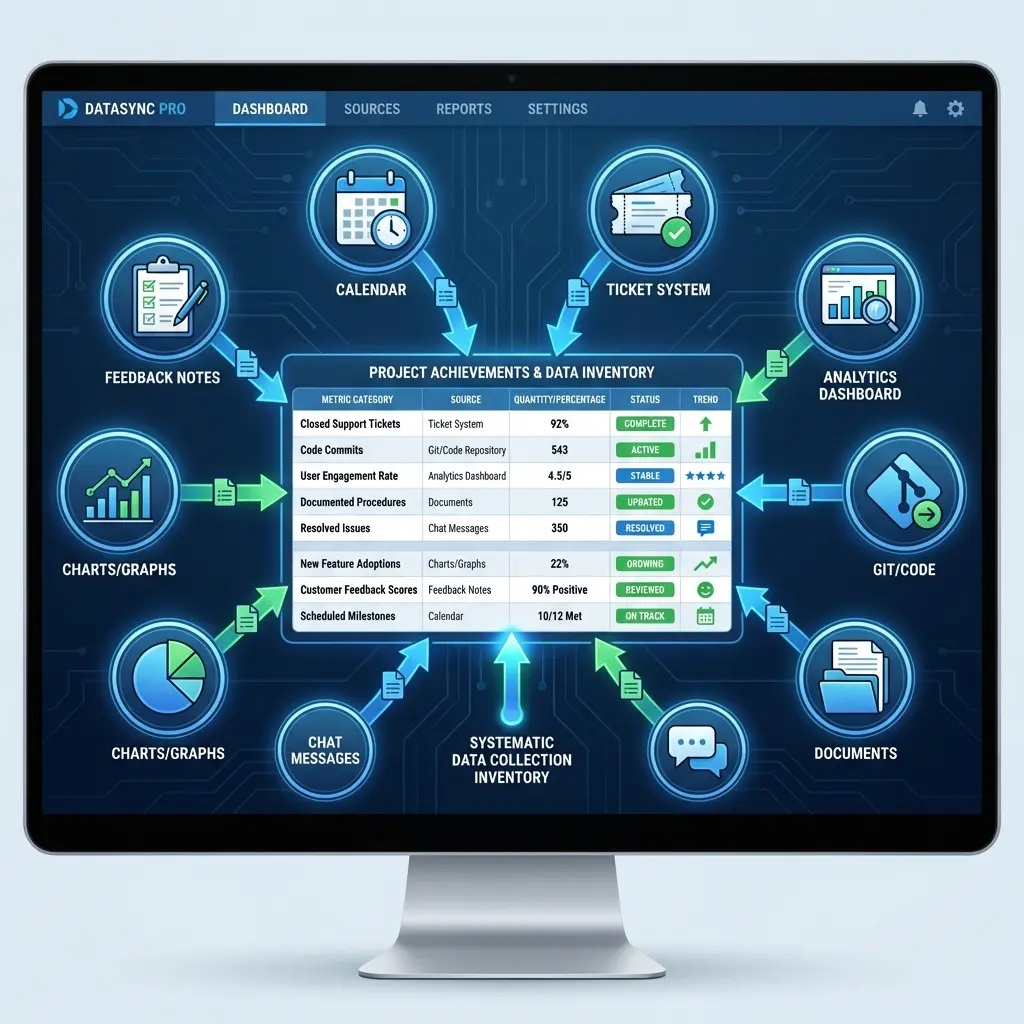
The 8 Data Sources for Hidden Metrics
Source #1: Your Calendar (Scope \u0026 Frequency)
Why it matters: Your calendar is a log of how you spend time—and with whom. This reveals scope (how many stakeholders), frequency (how often you lead vs. attend), and allocation (where you add value).
What to extract:
How to mine it:
- Export last 30 days of calendar (Google Calendar → Settings → Import/Export)
- Open in Excel/Sheets and filter by meeting organizer = you
- Count unique attendees, department diversity, recurring vs. one-off meetings
- Calculate: meetings per week, average attendee count, percentage of time in
cross-functional collaboration
Example metrics extracted:
- "Led 15+ cross-functional stakeholder meetings weekly across product, engineering, design, and marketing"
- "Coordinated alignment across 8 different teams and 45+ stakeholders"
- "Facilitated weekly retros for team of 12"
Source #2: Ticket/Task Systems (Throughput \u0026 Velocity)
Why it matters: Jira, Linear, Asana, Trello, GitHub Issues—these systems track everything you shipped. This is your throughput and velocity proof.
What to extract:
How to mine it:
- Go to your ticket system (Jira/Linear/Asana)
- Filter by assignee = you, date range = last quarter
- Export to CSV
- Calculate:
- Total tickets closed
- Average close time
- Types of tickets (bugs, features, improvements)
- Comparison to team average (if available)
Example metrics extracted:
- "Resolved 200+ customer tickets per quarter with 95% first-contact resolution rate"
- "Closed 45 feature tickets in Q4, 30% above team average velocity"
- "Reduced average ticket resolution time from 3 days to 8 hours"
- "Decreased backlog from 150 open issues to 40 (73% reduction)"
Source #3: Dashboards \u0026 Analytics (Performance Trends)
Why it matters: If you have access to Google Analytics, Mixpanel, Amplitude, Looker, Tableau, or internal dashboards—screenshot everything regularly. These are your before/after proof points.
What to extract:
How to mine it:
- Take screenshots NOW (before you leave the company or lose access)
- Capture: date range, before/after states, trend lines
- Note any major inflection points ("feature launched here")
- Save with timestamps and context
Example metrics extracted:
- "Grew monthly active users from 12K to 28K (133%) in 6 months"
- "Increased conversion rate from 2.3% to 4.1% through checkout redesign"
- "Improved page load speed from 4.2s to 1.8s (57% faster)"
- "Reduced churn rate from 8% to 4.5% through onboarding improvements"
Source #4: Git/GitHub (Code Contribution)
Why it matters: For engineers, your commit history, PR count, code reviews, and contributions are quantifiable proof of output.
What to extract:
How to mine it:
- GitHub → Your Profile → Contributions Graph
- Use tools like
git-statsorgit-quick-statsfor detailed analysis - Check PR history for merge count and review activity
Example metrics extracted:
- "Contributed 500+ commits across 12 repositories in 2024"
- "Merged 80+ pull requests with 99% approval rate on first review"
- "Reviewed 200+ PRs, maintaining team code quality standards"
- "Maintained 15% of production codebase (authentication and API layer)"
Source #5: Performance Reviews \u0026 Feedback (Manager Validation)
Why it matters: Your manager already wrote down your achievements. Go find them.
What to extract:
How to mine it:
- Search email for: "performance review," "feedback," "1:1 notes," "check-in"
- Look for phrases like: "delivered X," "increased Y," "reduced Z"
- Extract any numbers mentioned
- Save exact quotes for reference
Example metrics extracted:
- "Exceeded quarterly goals by 25% (per Q4 2024 review)"
- "Received 'exceeds expectations' rating 3 consecutive quarters"
- "Promoted from IC3 to IC4 based on impact across 5 major projects"
- "Manager quote: 'Reduced deployment time 40% through CI/CD improvements'"
Source #6: Project Documentation (Scope \u0026 Budget)
Why it matters: Project docs, PRDs, project charters, and post-mortems contain scoped timelines, team sizes, and budget info—all quantifiable.
What to extract:
How to mine it:
- Search Confluence, Google Drive, Notion for project docs
- Look for: "project scope," "team composition," "success metrics," "budget"
- Extract numbers from kickoff decks, retros, post-mortems
Example metrics extracted:
- "Led $2M product development project from concept to launch"
- "Managed cross-functional team of 15 (5 eng, 4 design, 3 product, 3 marketing)"
- "Delivered project 2 weeks ahead of 6-month timeline"
- "Shipped 12 major features across 3 product areas"
Source #7: Retrospectives \u0026 Team Feedback (Process Wins)
Why it matters: Retros capture process improvements, efficiency gains, and team sentiment—often with specific numbers.
What to extract:
How to mine it:
- Search retro docs for phrases: "thanks to [your name]," "improved," "faster," "reduced"
- Look for time-based wins: "we're now shipping 2x faster"
- Extract team sentiment scores if tracked
Example metrics extracted:
- "Implemented code review checklist, reducing bug count 40%"
- "Automated deployment process, cutting release time from 2 hours to 15 minutes"
- "Introduced async standups, reducing meeting time 75% (5 hours → 1.25 hours weekly)"
- "Team velocity increased from 30 to 45 story points per sprint after sprint planning refinement"
Source #8: Saved Emails \u0026 Slack Messages (External Validation)
Why it matters: Thank-you emails, kudos in Slack, and client praise often include specific outcomes you delivered—proof from others.
What to extract:
How to mine it:
- Search email for: "thank you [your name]," "great job," "saved us," "helped us achieve"
- Search Slack for: mentions of your name in #wins, #kudos, #thanks channels
- Look for specific numbers in the praise
Example metrics extracted:
- "Client email: 'Your work saved us $50K in operational costs'"
- "Slack kudos: 'Resolved critical bug affecting 10K users in under 2 hours'"
- "Executive mention: 'Led initiative that drove 30% increase in retention'"
- "Received 'Engineer of the Quarter' award (top 5% of org)"
The Metrics Inventory Spreadsheet
Template Structure
Create a Google Sheet with these columns:
| Date | Achievement | Data Source | Metric Type | Number | Context | Verification |
|---|---|---|---|---|---|---|
| 2024-Q4 | Reduced deployment time | Retro notes | Velocity | 40% faster | CI/CD pipeline | Retro doc link |
| 2024-12 | Led cross-functional alignment | Calendar | Scope | 45 stakeholders | Product launch | Calendar export |
| 2024-11 | Improved conversion rate | Dashboard | Impact | 2.3% → 4.1% | Checkout flow | GA screenshot |
Metric Type categories:
Monthly Spot Check (10 minutes)
Every month, add:
Quarterly Deep Review (1 hour)
Every 90 days, systematically mine:
- Calendar (last 30 days)
- Tickets (last quarter)
- Dashboards (screenshot current state)
- Git activity (if engineer)
- Performance review (if timing aligns)
- Project docs (recent projects)
- Retros (look for your contributions)
- Email/Slack (search for praise/outcomes)
Result: 20-30 quantified achievements ready to pull from for resume updates.
From Inventory to Resume Bullet
Example: Converting Inventory Entry to Resume
Inventory entry:
| Date | Achievement | Source | Type | Number | Context |
|---|---|---|---|---|---|
| 2024-Q4 | Reduced customer support ticket volume | Dashboard | Impact | 35% reduction | Built FAQ + chatbot |
Resume bullet:
"Built self-service FAQ and chatbot, reducing customer support ticket volume 35% and enabling support team to focus on complex escalations"
Why it works: Shows initiative (built), impact (35% reduction), business context (support focus shift).
Verification: Can You Defend It?
The interview question: "Walk me through how you achieved this 35% ticket reduction."
Your answer (from inventory context):
"I analyzed our support ticket data and found 60% were repeat questions about account setup and billing. I built a comprehensive FAQ mapping to these common issues and implemented a chatbot that surfaces relevant articles before ticket submission. We measured a 35% decrease in tickets over the following quarter, and support team satisfaction improved because they could focus on complex issues requiring human judgment."
Verification method: Dashboard screenshot + project doc showing before/after ticket volume.
Common Mistakes to Avoid
Frequently Asked Questions
What is a metrics inventory for resumes?
A metrics inventory is a systematic collection of quantified achievements extracted from your work data sources: calendar (meetings, time allocation), tickets (throughput, resolution time), dashboards (KPIs, trends), logs (system performance), and retrospectives (team feedback). It's your proof library for resume bullets.
How do I find metrics if I'm not in sales?
Every role has metrics. For example:
- Engineers: deployment frequency, uptime, bug reduction (see our Engineering Metrics Guide).
- Designers: iteration cycles, user testing sessions.
- PMs: feature delivery rate.
- Operations: efficiency and cost savings.
What should I track in my metrics inventory?
Track 5 categories: Volume (how many/much), Velocity (how fast), Quality (error rates, satisfaction), Impact (revenue, cost, time saved - see Revenue Metrics for Non-Sales Roles), and Scope (team size, budget, stakeholders). Update quarterly with new achievements.
Where do I find hidden metrics from past jobs?
Check your email archive for: performance reviews, project summaries, quarterly reports, thank-you messages with specific outcomes. LinkedIn messages, old calendars, project management tool exports, and GitHub contributions also contain quantifiable data.
How often should I update my metrics inventory?
Monthly spot checks (add major wins immediately) and quarterly deep reviews (mine all 8 data sources systematically). Set calendar reminders so your inventory stays current and you never scramble for numbers during job searches.
Your Action Plan
The Bottom Line
You don't have a metrics problem. You have a data collection problem.
The numbers exist—in your calendar, tickets, dashboards, logs, retros, reviews, and docs. You just need a system to extract and organize them.
Build the inventory now. Update it quarterly. Pull from it anytime you need proof.
Because the difference between "I improved performance" and "I reduced deployment time 40%, cutting release cycles from 2 hours to 15 minutes" is the difference between getting overlooked and getting interviewed.
Stop saying "I don't have metrics." Start building your inventory.