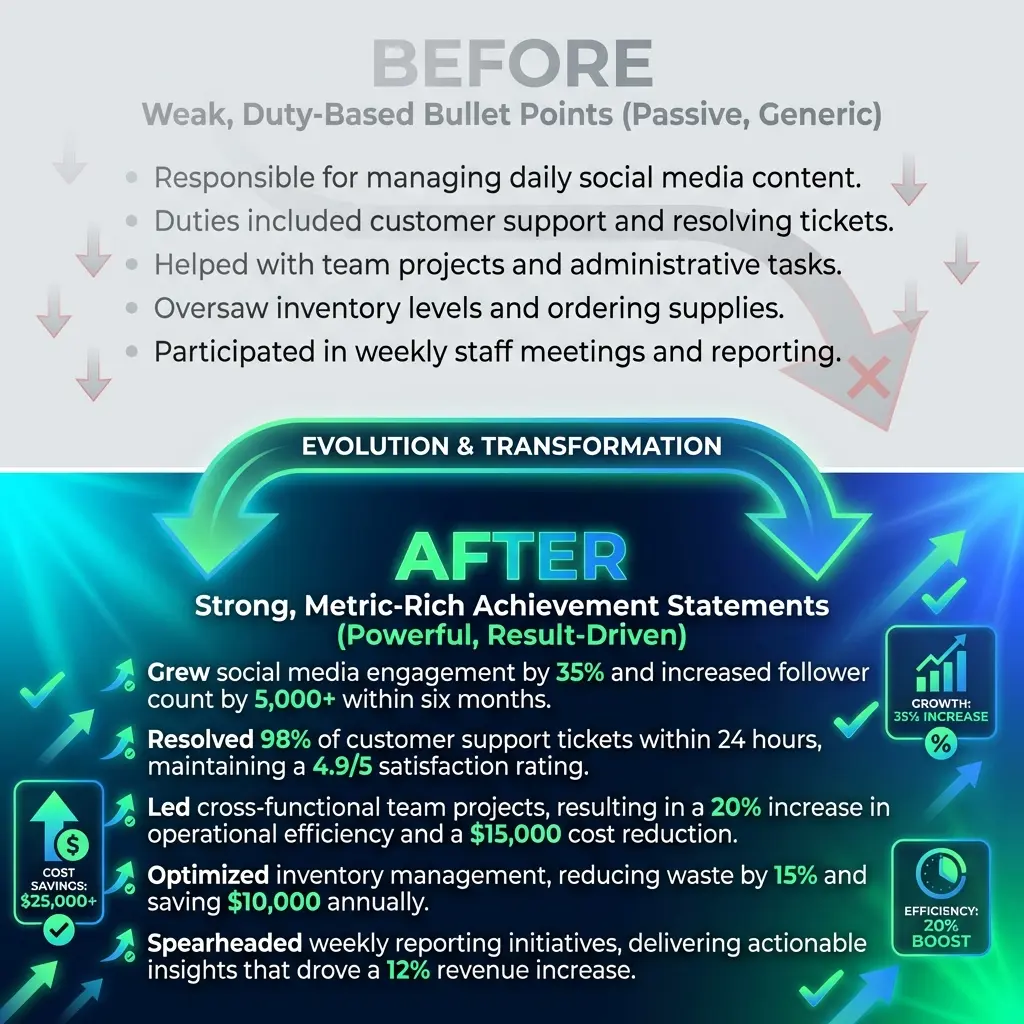
Resume "Before vs After" Case Studies
You know your resume is weak. You just don't know exactly why.
Let me show you.
This article isn't a gallery of "look how pretty this is" transformations. It's a diagnostic. For each example, I'll break down:
- Before: What was weak (duty-based? no metrics? vague?)
- Why it failed: Specific diagnosis (fluff? no context? no impact?)
- After: How it was rewritten (verb + context + metric)
- Why it's stronger: Logical breakdown of improvement
The goal isn't to copy these bullets. It's to internalize the thought process so you can diagnose and fix your own resume. For the complete methodology on translating experience into impact, see our Ultimate Experience Translation Guide. Let's go.
How to Use These Case Studies
This is not a template library. If you copy these bullets verbatim, they'll fail—because they're not your experience.
Instead, use this framework for every weak bullet you find:
- Identify the weakness (duty vs. impact? missing metrics? no context?)
- Apply the fix (add outcome, quantify scale, show value)
- Ask "So what?" (Does this prove I made something better, faster, or cheaper?)
Case Study 1: Software Engineer
Before
Developed features for the company's web application.
Why It Failed
- No specificity: "Features" could mean anything—bug fixes, UI tweaks, backend logic.
- No scale: How many features? How complex? What tech stack?
- No outcome: Did users engage more? Did it improve performance? Revenue?
- Final diagnosis: Pure activity. No proof of value.
After
Built 8 customer-facing features (React, Node.js) increasing user engagement by 35% and reducing page load time from 4.2s to 1.8s (57% improvement).
Why It's Stronger
- Specificity: "8 features" + tech stack (React, Node.js) = clear scope
- Context: "Customer-facing" signals front-end work with UX impact
- Dual metrics: Engagement growth (35%) + performance improvement (57%)
- Business value: Faster load times → better UX → likely higher retention
- What this proves: You shipped measurable product improvements, not just tickets.
Case Study 2: Project Manager
Before
Managed multiple projects across different teams to ensure deadlines were met.
Why It Failed
- Vague scale: "Multiple projects" = 2? 20?
- No outcomes: Met deadlines is the baseline expectation, not an achievement.
- Missing context: What kind of projects? What stakes? What constraints?
- Final diagnosis: Job description, not resume proof.
After
Led 12 cross-functional projects ($2.5M total budget) with 98% on-time delivery rate, including early completion of Q4 product launch (2 weeks ahead of schedule, enabling $500K revenue capture).
Why It's Stronger
- Quantified scope: 12 projects, $2.5M budget = clear scale
- Performance metric: 98% on-time = above baseline, not just meeting it
- Highlight achievement: Early Q4 launch with revenue tie-in
- Business value: Early delivery = faster revenue realization
- What this proves: You don't just manage timelines—you accelerate business outcomes.
Case Study 3: Marketing Manager
Before
Responsible for managing social media accounts and increasing brand awareness.
Why It Failed
- "Responsible for": Classic duty language—what was the job, not what you achieved
- "Brand awareness": Vanity metric with no measurable definition
- No strategy: Posting content ≠ strategic marketing
- Final diagnosis: Activity without ROI proof.
After
Grew Instagram following from 5K to 42K (740% increase) and LinkedIn engagement by 250%, driving 3,000+ qualified leads and $1.2M in attributed pipeline over 18 months.
Why It's Stronger
- Concrete growth: 5K → 42K followers = specific, verifiable improvement
- Engagement metric: 250% LinkedIn growth shows cross-platform strategy
- Business impact: 3K leads + $1.2M pipeline = revenue connection
- Timeline context: "18 months" shows sustained effort, not a fluke
- What this proves: You didn't just post—you generated pipeline.
Case Study 4: Customer Success Manager
Before
Handled customer inquiries and provided support to ensure satisfaction.
Why It Failed
- Generic verb: "Handled" = passive, reactive
- No metrics: How many customers? What satisfaction level?
- No improvement: Meeting baseline expectations isn't an accomplishment
- Final diagnosis: Describes the job, not your performance.
After
Managed 80+ enterprise accounts ($4M ARR) with 96% retention rate and improved NPS from 42 to 68, reducing churn by 30% and driving $800K in upsell revenue.
Why It's Stronger
- Scale: 80 accounts, $4M ARR = portfolio size and business value
- Retention metric: 96% retention = clear performance benchmark
- Improvement: NPS improvement (42 → 68) + churn reduction (30%)
- Revenue impact: $800K upsells = direct P&L contribution
- What this proves: You didn't just support customers—you grew accounts and prevented churn.
Case Study 5: Data Analyst
Before
Analyzed data to provide insights for the business team.
Why It Failed
- Circular logic: "Analyzed data to provide insights" = saying nothing twice
- No methodology: What kind of analysis? What tools? What scale?
- No decision impact: Insights that don't drive action are noise
- Final diagnosis: Vague abstraction with zero proof.
After
Built automated sales forecasting model (Python, SQL) improving prediction accuracy from 72% to 91%, enabling VP of Sales to reallocate $1.5M budget and hit quarterly targets 3 quarters in a row.
Why It's Stronger
- Specific output: "Forecasting model" with tools (Python, SQL)
- Measurable improvement: 72% → 91% accuracy = clear technical win
- Business decision: Budget reallocation ($1.5M) = executive impact
- Sustained outcome: 3 consecutive quarters = reliability, not luck
- What this proves: Your analysis drove real strategic decisions, not just dashboards.
Case Study 6: Sales Representative
Before
Met and exceeded sales quotas.
Why It Failed
- Baseline expectation: Meeting quota is required, not impressive
- No scale: Quota could be $10K or $10M—context matters
- No relative performance: "Exceeded" by how much? Top performer or middle?
- Final diagnosis: Participation trophy language.
After
Exceeded quota by average of 135% over 8 consecutive quarters, ranking #2 of 40 reps and closing $3.2M in new business with 85% win rate (vs. team avg. 62%).
Why It's Stronger
- Quantified overperformance: 135% of quota = clear outperformance
- Consistency: 8 consecutive quarters = sustained excellence
- Relative ranking: #2 of 40 = top 5%, context for competitiveness
- Volume + quality: $3.2M closed + 85% win rate (both above team avg.)
- What this proves: You're not just meeting targets—you're a top performer.
Case Study 7: Operations Manager
Before
Improved operational processes and streamlined workflows.
Why It Failed
- Vague verbs: "Improved" and "streamlined" without quantification mean nothing
- No baseline: Processes were at X, you got them to Y—missing both
- No outcome: Did this save time? Money? Reduce errors?
- Final diagnosis: Aspirational claims without proof.
After
Redesigned inventory management process reducing stockouts by 60% (from 25 to 10 per month) and cutting order fulfillment time from 48 hours to 18 hours, saving $200K annually in expedited shipping costs.
Why It's Stronger
- Specific problem: Stockouts reduced (25 → 10/month)
- Speed improvement: Fulfillment time cut by 62.5% (48h → 18h)
- Cost savings: $200K/year = financial impact
- Process clarity: "Inventory management" = specific operational area
- What this proves: You fixed a measurable problem and saved real money.
Case Study 8: UX Designer
Before
Designed user interfaces for mobile applications.
Why It Failed
- Pure activity: Designing UIs is the job title, not the achievement
- No user impact: Did usability improve? Engagement? Conversion?
- No iteration: Landing the right design is harder than creating any design
- Final diagnosis: Portfolio item, not resume proof.
After
Redesigned onboarding flow (4 screens → 2 screens) increasing sign-up completion rate from 62% to 84% (35% improvement) and reducing time-to-first-action from 12 minutes to 4 minutes, validated through A/B testing with 10K users.
Why It's Stronger
- Design decision: 4 screens → 2 screens = clear simplification
- Conversion impact: 62% → 84% completion = measurable UX win
- Speed metric: 12min → 4min = faster time-to-value
- Validation rigor: A/B tested with 10K users = data-driven, not opinion
- What this proves: Your design choices improved real business outcomes.
Case Study 9: HR Generalist
Before
Coordinated recruiting and onboarding for new hires.
Why It Failed
- Process description: Coordinating ≠ improving
- No scale: How many hires? What velocity? What complexity?
- No quality metric: Hiring fast is useless if quality or retention is bad
- Final diagnosis: Admin task list, not strategic HR.
After
Managed end-to-end recruiting for 50+ hires annually, reducing time-to-hire from 45 days to 28 days (38% improvement) while maintaining 92% 1-year retention rate and 4.5/5 new hire satisfaction score.
Why It's Stronger
- Volume: 50+ hires/year = recruiting scale
- Efficiency: Time-to-hire reduced by 38% = process optimization
- Quality metrics: 92% retention + 4.5/5 satisfaction = not just fast, but good
- Balanced proof: Speed + quality = strategic recruiting, not rushed hiring
- What this proves: You didn't just fill seats—you built a quality pipeline.
Case Study 10: Finance Analyst
Before
Prepared financial reports and forecasts for management.
Why It Failed
- Pure mechanics: "Prepared reports" = clerical work, not strategic insight
- No decision impact: Reports that sit in inboxes don't matter
- No accuracy metric: Forecasts are only valuable if they're right
- Final diagnosis: Monthly deliverable, not career proof.
After
Built monthly financial forecast model with 95% accuracy (vs. 78% baseline), identifying $500K cost-saving opportunity in Q3 and enabling CFO to reallocate budget toward 2 strategic hires and capital investment.
Why It's Stronger
- Accuracy improvement: 95% vs. 78% = clear analytical upgrade
- Insight value: Identified $500K savings = strategic contribution
- Executive impact: CFO used your work to make real decisions
- Actionable outcome: Reallocation toward hires + investment = business acceleration
- What this proves: Your analysis drove financial strategy, not just compliance.
Common Patterns in "Before vs After" Transformations
Looking across all 10 cases, here's what separates weak bullets from strong ones:
How to Self-Audit Your Resume Using These Examples
For every bullet on your resume, ask these 5 questions:
-
Does it describe what I did or what changed?
If "what I did," rewrite to show the outcome. -
Could someone outside my company understand the scale?
If no, add context: team size, budget, timeline, volume. -
Is there a measurable improvement?
If no, find one: percentage change, dollar impact, time saved. -
Am I claiming the baseline or exceeding it?
"Met quota" is baseline. "135% of quota" is achievement. -
Would a recruiter reading this in 6 seconds know I made something better?
If they'd pause and wonder "so what?"—rewrite.
Frequently Asked Questions
Can I use percentages if I don't have exact numbers?
Yes, if you can defend the approximation. If you increased engagement but don't have exact metrics, estimate conservatively:
- "Increased engagement by approximately 40% based on monthly active user trends (from ~5K to ~7K)"
Rough estimates with context are better than silence—just don't fabricate precision you can't support.
What if I legitimately can't quantify my work?
Then focus on scope and process improvements:
- Before: "Wrote documentation."
- After: "Created 15-page technical documentation for internal API, reducing onboarding time for 3 new engineers from 2 weeks to 5 days based on team feedback."
Qualitative outcomes (faster onboarding, better clarity) with directional metrics (weeks → days) still beat pure activity.
Should I include failures or pivots in my resume?
Only if they show learning or strategic adaptation:
- ❌ "Launched feature that was later deprecated"
- ✅ "Launched beta feature to 1,000 users, gathered feedback revealing 60% UX friction, leading to redesign that achieved 85% adoption in V2"
Show iteration and adaptability, not just setbacks.
How do I know if my "after" bullet is good enough?
Use the 6-second scan test:
- Cover the bullet.
- Uncover it.
- Read for 6 seconds max.
- Ask: "Do I know this person made something measurably better?"
If the answer is "maybe" or "I need more context," the bullet is still weak.
What if my before/after transformation feels too similar to these examples?
That's the point. The formulas repeat because impact structure is universal:
- Verb + Context + Metric
- Baseline → Improvement
- Scale + Outcome
The details will differ (your tech stack, your metrics, your context), but the architecture is the same. If your transformation follows the same pattern, you're doing it right.
Final Thoughts
Weak bullets describe what the job was. Strong bullets prove you did it well.
The difference isn't vocabulary or formatting—it's specificity, scale, and outcomes. Every transformation in this article followed the same logic:
- What was weak? (duty, no metric, vague)
- What was the fix? (verb + context + metric)
- Why does it work now? (proof of value)
Use that diagnostic framework on every bullet. Don't copy these examples—internalize the thought process. Then your resume won't just describe your career. It'll prove you made things better.